Accountants navigating the complexities of financial reporting in Xero and QuickBooks face a common challenge: merging detailed data efficiently.
The solution?
A chart of accounts template in Excel.
This tool transforms your reporting process, enhancing customization and accuracy while saving time.
In this article, we explore how integrating an Excel add-in with Xero and QuickBooks streamlines reporting tasks, addresses platform limitations, and ultimately elevates your financial management.
In this article, we’ll cover:
- Reporting Challenges in Xero and QuickBooks
- Why Excel Is The Optimal Choice for Crafting Customized Financial Reports
- Enhancing Excel with Templates and a Simple Add-in
4 Reporting Challenges in Xero and QuickBooks
In both Xero and QuickBooks, the chart of accounts is essential for keeping financial records organized.
While Xero and QuickBooks are indispensable tools in business accounting, they have limitations when it comes to creating certain types of financial reports, such as P&Ls or end of month reports that need to combine various data sources.
This is particularly challenging for accountants managing multiple clients’ company’s accounts and business finances.
1. Custom Reporting Limitations
Creating complex, customized reports like a detailed income statement or cash flow statement can be cumbersome when dealing with businesses with multiple entities.
These platforms may not offer the flexibility needed for specific account types or income accounts, limiting the depth of financial analysis.
2. Manual Data Export for End-of-Month Reports
Generating end-of-month reports often means manually exporting data into an Excel template.
This process is time-consuming and prone to errors, especially when handling various expense accounts or sales data for different clients.
3. Intricacies of Profit & Loss Reports
Creating a nuanced P&L report on these platforms can be challenging.
They might not easily accommodate complex requirements like breaking down revenue into various income categories or detailed analysis of cost of goods sold.
4. Time-Intensive Client Management
Accountants managing business expenses and income for multiple clients face the challenge of individually exporting and importing accounts data, making it a labor-intensive process.
How To Enhance Reporting with Excel Templates
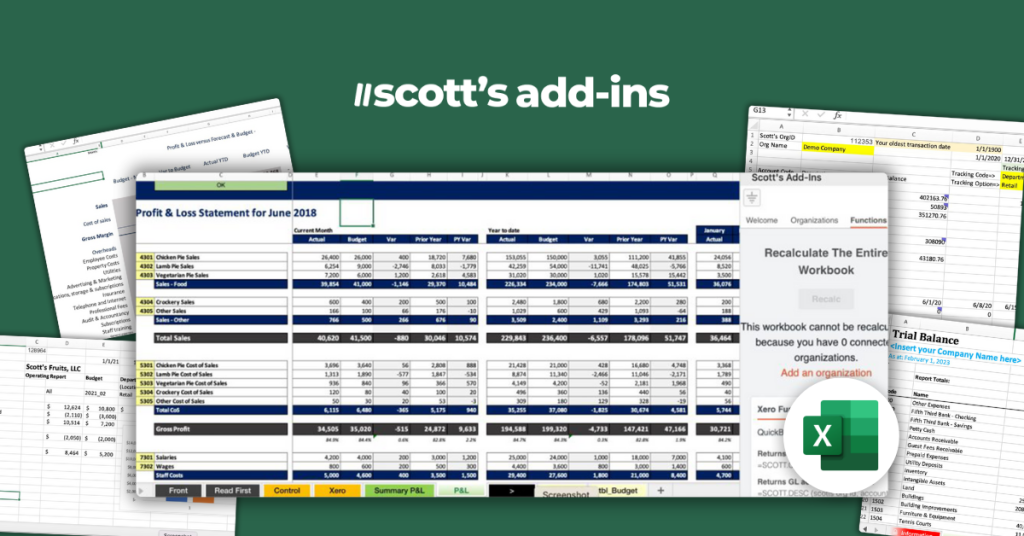
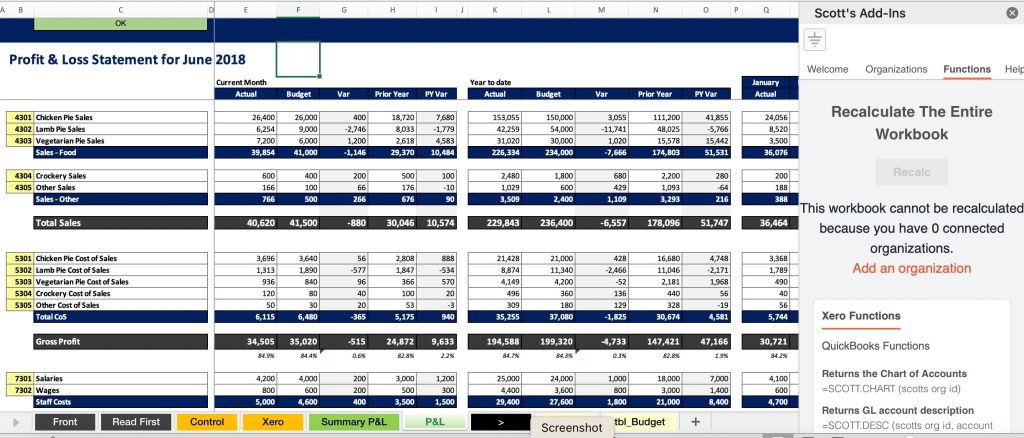
To address these issues, using an Excel add-in like Scott’s add-ins for Excel allows you to sync live General Ledger data from QuickBooks and Xero to Excel.
This ultimately saves you hours when building and updating reports.
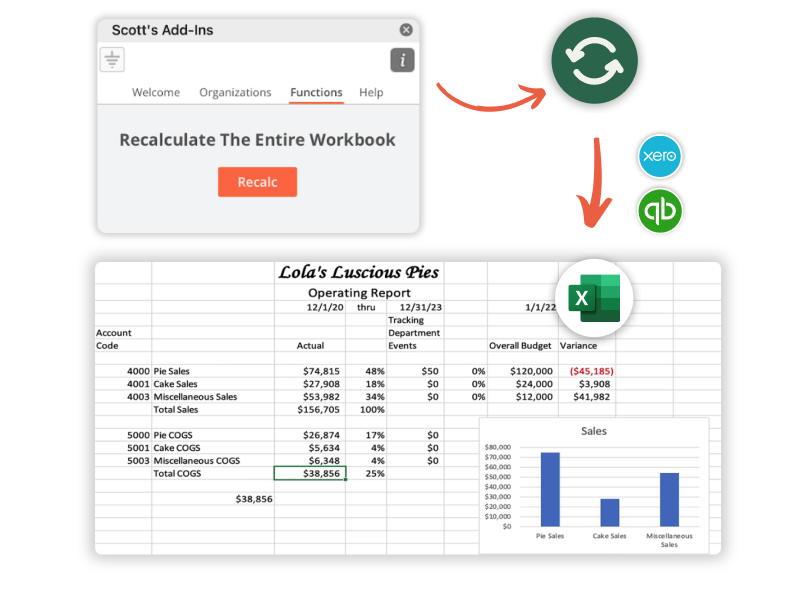
Use the 1-click recalc feature to update your reports with live data in seconds. Straight from your Excel spreadsheet. Try Scott’s add-ins free for 15 days!
Why Excel Is The Optimal Choice for Crafting Customized Financial Reports
Using Excel in conjunction with Xero and QuickBooks thus becomes a strategic choice for accountants.
It not only saves time but also enhances the accuracy and comprehensiveness of financial reports, essential in presenting a complete picture of a client’s financial health.
Try out this simple P&L statement modeling sheet from our friends at Full Stack Modeller.
Tailor-Made Reports with Advanced Customization
With a chart of accounts template in excel, you gain unparalleled flexibility to customize every aspect of your reports to meet unique client needs, not just limiting yourself to account hierarchy, account names, and account titles.
Streamlined Data Management
Excel’s powerful features make managing a company’s financials a breeze. Efficiently handle company’s assets, liabilities, and equity, and keep track of transactions and financial data with ease.
Minimized Errors, Maximized Accuracy
Using structured Excel templates for your financial reports drastically cuts down the chance of errors. This means your management of accounts and expenses is more reliable and precise.
Dynamic Financial Analysis at Your Fingertips
Dive deep into net income, scrutinize business expenses, and dissect balance sheet components with Excel’s versatile analysis tools.
Chart of Accounts Template–Excel Made Better with Scott’s Add-ins
It’s not just about tracking every transaction; it’s about providing a framework that helps businesses understand their financial situation, plan for the future, and comply with financial reporting requirements.
A well-structured Chart of Accounts, be it in Xero, QuickBooks, or an Excel template is indispensable for effective financial management.
It not only simplifies the process of accounting but also enhances the accuracy and accessibility of financial information, crucial for any business’s success.
Grab your free Excel templates for Quickbooks and Xero here.